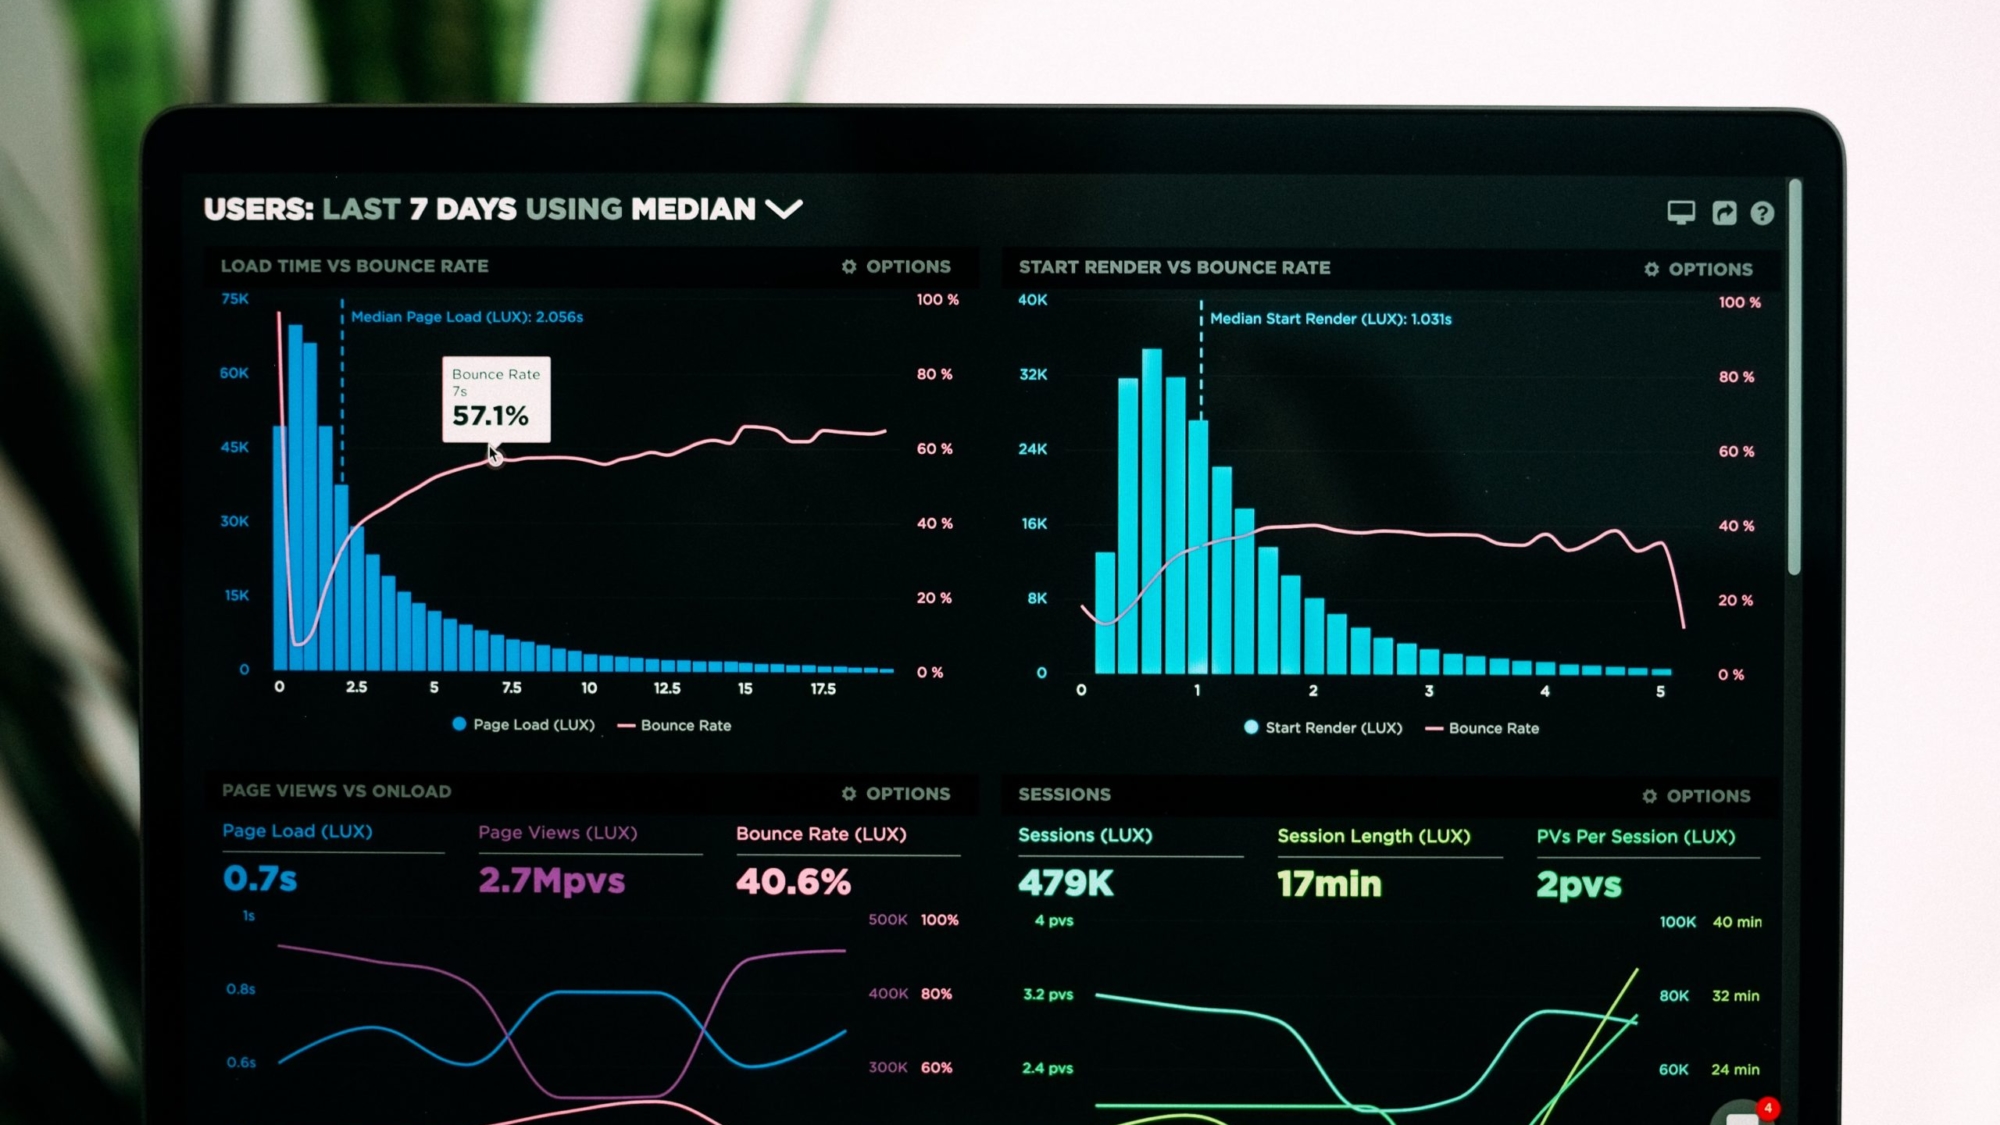
At MASCORP , we don’t just visualize data—we give it a glow-up! We assist you in developing and utilizing your BI Data Visualization strategy, refining raw data, and transforming it into effective and intuitive visual information. Whether you’re swimming in an ocean of numbers or drowning in Excel sheets, we help you make sense of it all. And if that wasn’t enough, we also implement enterprise-level data warehouses, ensuring that your data isn’t just pretty but also powerful.
Why BI Data Visualization is a Game-Changer
One of the essential components of big data and business intelligence services is BI Data Visualization. Without it, making sense of complex datasets is like trying to read The Matrix without being Neo. Visual representation is a key component of data analytics because it offers a clear approach to identifying and analyzing patterns and trends in data. Whether it’s bar charts, scatter plots, or mind-blowing interactive dashboards, our solutions ensure that your business stays ahead of the curve.
What MASCORP Brings to the Table
1. Gain Deep Customer Insights
Your customers are talking—you just need to listen. BI visualization helps you understand customer behaviors, preferences, and pain points at a glance. With dynamic dashboards, you can easily track purchase patterns, customer journeys, and sentiment analysis. It’s like having a mind-reading superpower, minus the spandex.
2. Improved Business Operations Visibility
Ever feel like your business operations are a black hole of unknowns? Our visualization tools ensure that every department, from HR to logistics, can access relevant and clear operational insights. Identify bottlenecks, streamline workflows, and make decisions based on facts, not just gut feelings.
3. Get Actionable Insights
Data is great. Actionable data is better. We help you bridge the gap between information and execution. With real-time insights, you can make fast, informed decisions—before your competitors even know what hit them.
4. Improved Efficiency Across the Organization
Time is money, and inefficiency is a silent profit killer. With our BI visualization tools, employees can quickly interpret data without needing a PhD in rocket science. Less time spent analyzing spreadsheets = more time for innovation, strategy, and of course, coffee breaks.
5. Real-Time Data Availability
Data is like milk—it needs to be fresh. Our BI solutions ensure that you’re working with up-to-the-minute information, allowing you to make accurate decisions instantly. No more relying on last week’s sales report to forecast tomorrow’s growth.
6. Enhanced Decision-Making with Predictive Analytics
Why wait for problems to happen when you can predict them? With advanced analytics, you can forecast market trends, customer behaviors, and potential risks. Think of it as having a crystal ball—except it’s powered by data science and not mystical energy.
7. A Competitive Edge Like No Other
Let’s face it—business is a battlefield, and those who leverage their data effectively have the best arsenal. Our BI visualization solutions empower you with deep insights, helping you stay ahead of industry trends and crush the competition. Because who doesn’t love winning?
The Final Word: Make Your Data Work for You
Utilizing big data requires a critical combination of analytics and visualization. Data by itself might not be very useful to a company—it could be scattered across multiple datasets, locked in rigid formats, or just plain overwhelming. The goal of BI visualization is to turn this raw information into a goldmine of actionable insights.
At MASCORP, we make data work for you, not against you. Say goodbye to confusion and hello to clarity—because in the world of business, seeing is believing.
Let’s bring your data to life. Contact us today to revolutionize your BI strategy!

Add a Comment